Location: “Dashboard” in the main menu
The Assessment Dashboard is a great tool for viewing results of the assessments that have been assigned and executed with your assigned clients. This dashboard is organized into three sections: Clients and Users , Assessment Progress, Assessment Scores. As you assign and execute assessments that you’ve created from the Assessment menu area, you’ll see results and stats appear automatically in the Assessment Dashboard. Read below for more information about each section and the charts they contain.
Step 1: Go to the Assessment Administrative Dashboard 2
Step 5: View Assessment Progress tab 5
Step 6: Assessment Progress by User 7
Step 7: Assessment Progress by Client 8
Step 1: Go to the Assessment Administrative Dashboard
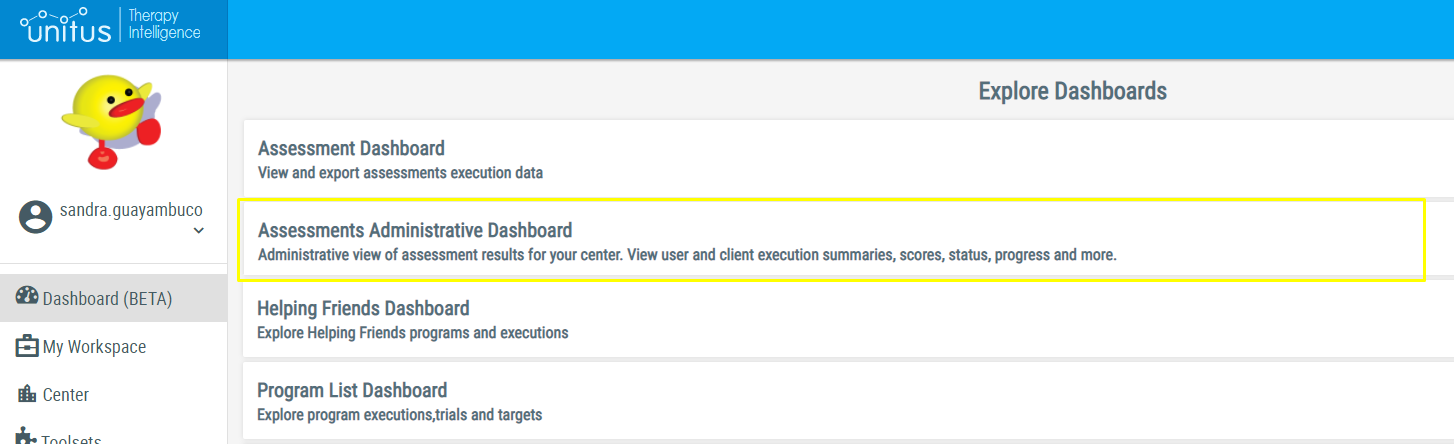
Navigate to Dashboard in the main menu on the left side of the UnitusTI workspace. Select “Assessment Administrative Dashboard” (see screenshot below)
Step 2: Filter by School
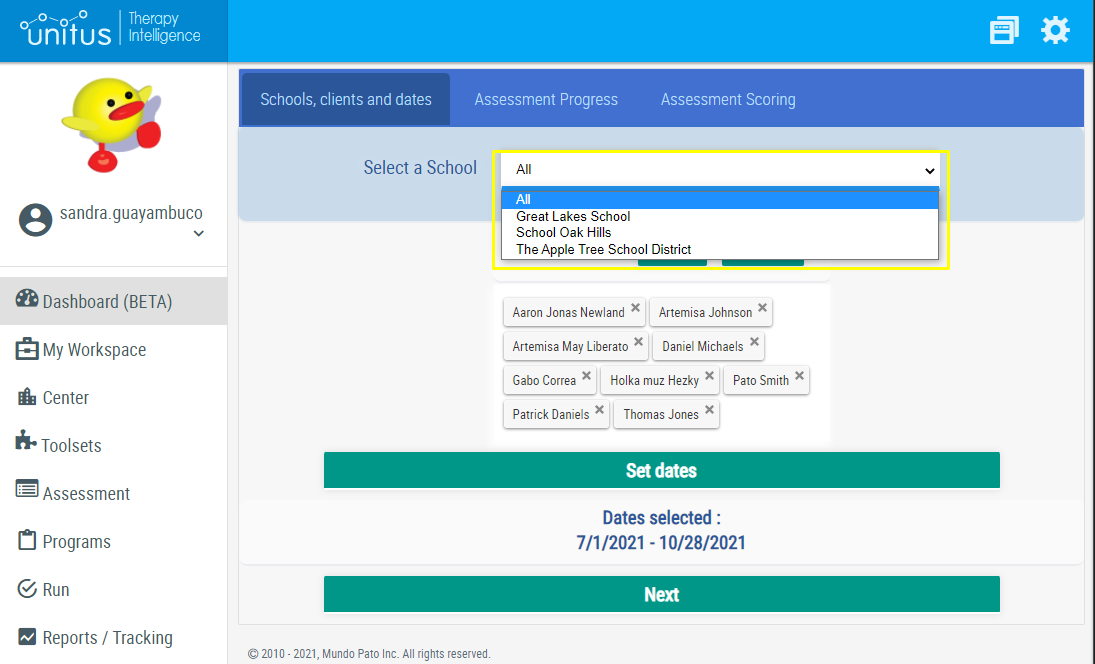
Select the school whose assessment results you wish to view or export. The “Select a School” dropdown list at the top of the screen is highlighted in the following screenshot.
Note that clients must have a school assigned to view them in this dashboard.
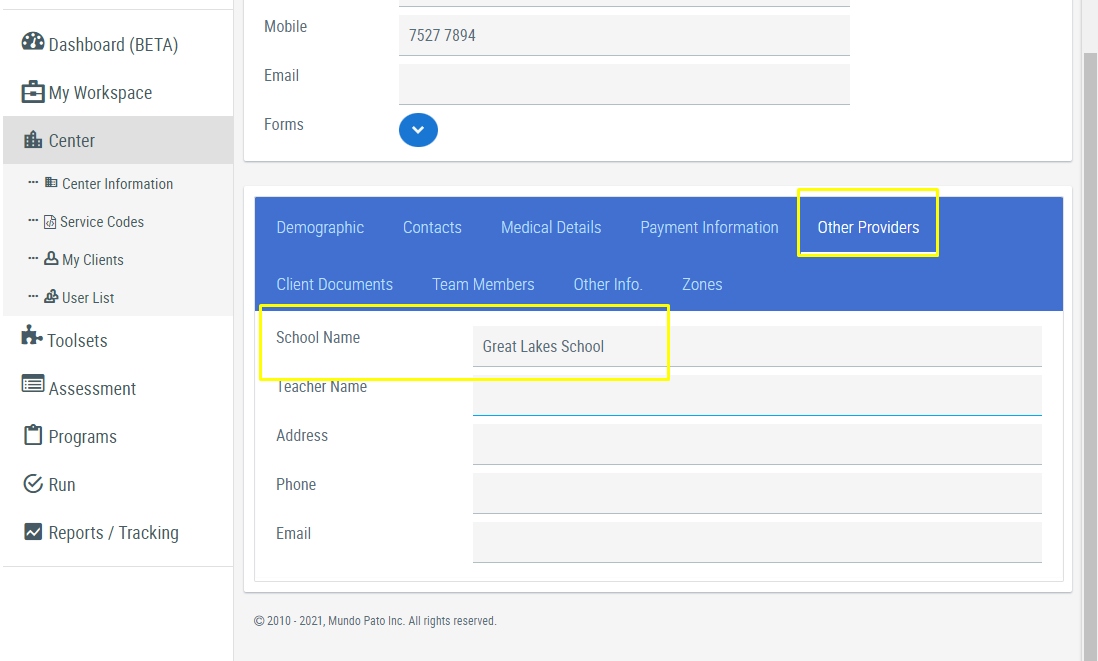
If this field is empty for you, your clients may not have a school saved. To change your clients’ school information, go to their Client profile in the “Other Providers” tab and Edit their School Name. The screenshot below shows where you can find the School Name field.
Step 3: Filter by Clients
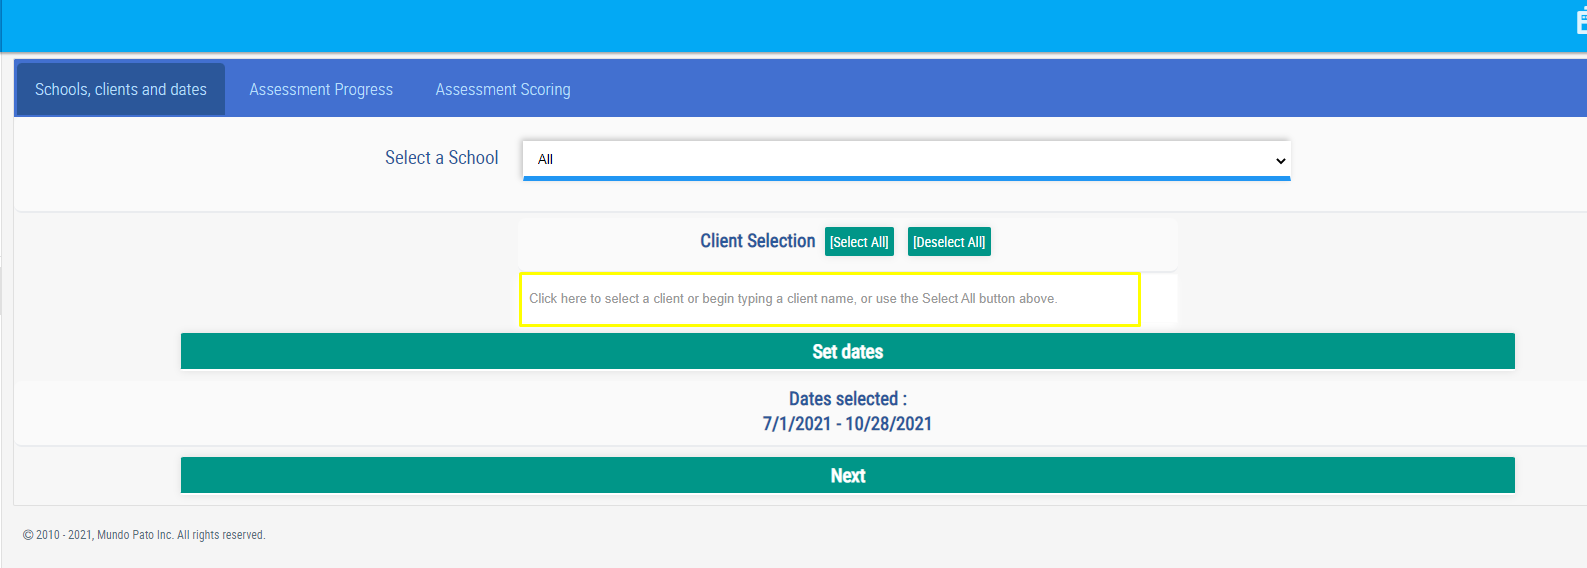
The next step will be to select the client(s) whose assessment results you wish to view using the Client Filter. In the “Client Selection” field (the row highlighted in yellow in the screenshot below), begin typing to add a client name or use the “Select All” button to add all clients.
Note that you must be assigned to a client to view them in this dashboard.
Step 4: Filter by Dates
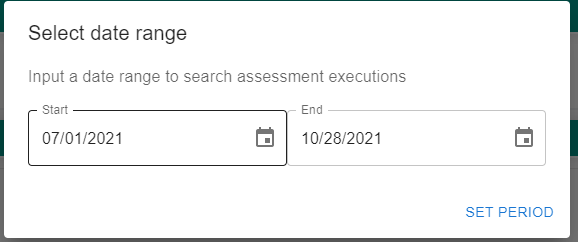
After selecting your client(s), the “Set Dates” button beneath the client filter section allows you to filter the assessment executions for a time range. Click or tap the “Set Dates” button to set a start and an end date of the period you want to report.
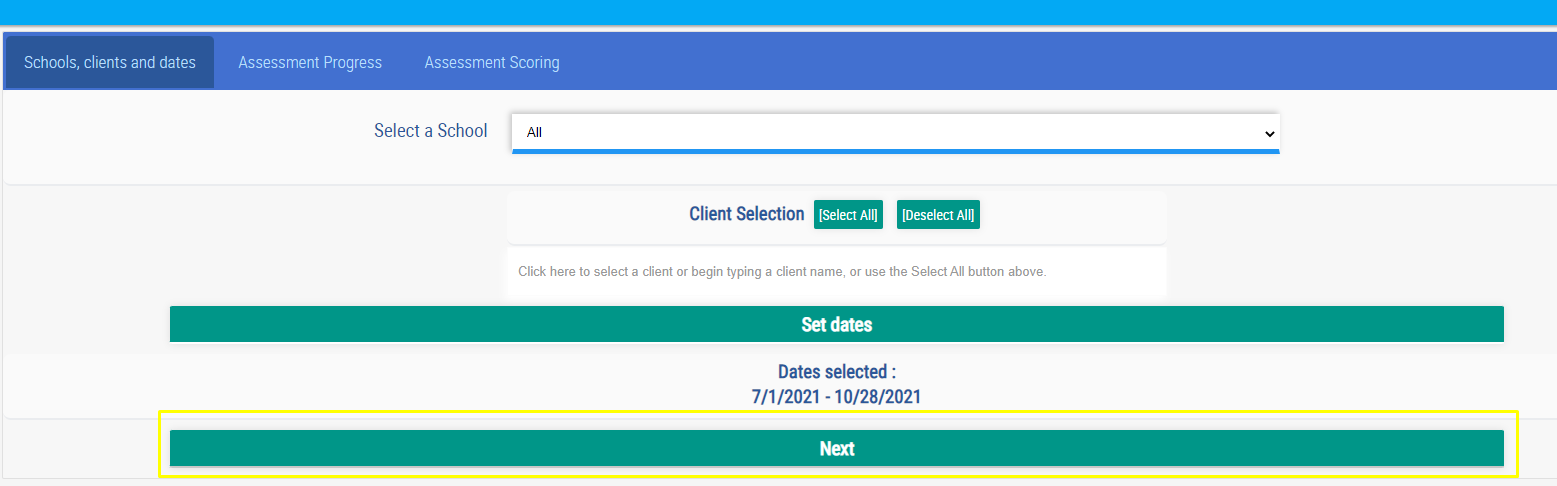
When you are ready, select the “SET PERIOD” button, followed by Selecting Next (highlighted in the screenshot below)
Step 5: View Assessment Progress tab
The next tab displays the client and the user filters, click or tap on the bars to filter the board. The list on the right shows the users by username and their assigned clients.
Select the Clear Filter button in the bottom right corner at any time to reset the filters applied by the charts.
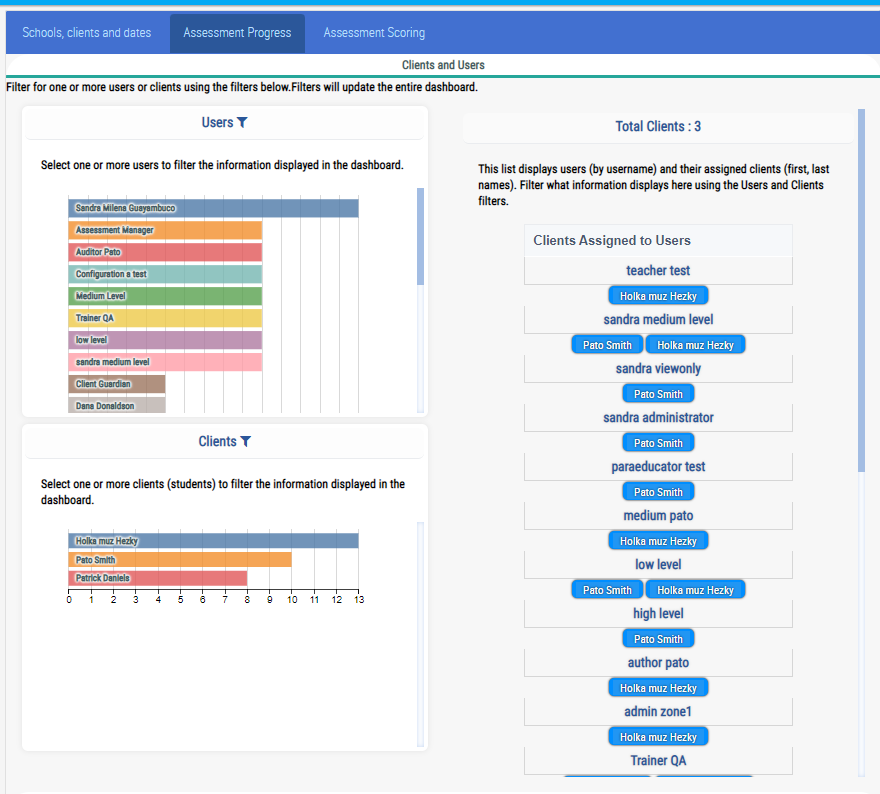
Chart |
What data is shown |
Users |
The bars display the number of clients assigned |
Clients |
The bars display the number of users assigned |
Clients Assigned to Users |
The show in blue bubbles the clients that are assigned to each user |
Step 6: Assessment Progress by User
Scrolling down, you can view two tabs. The tab of progress by user is made to view the progress of the assessments executions by user (teachers or staff). In this area, the charts are interactive and filter other charts.
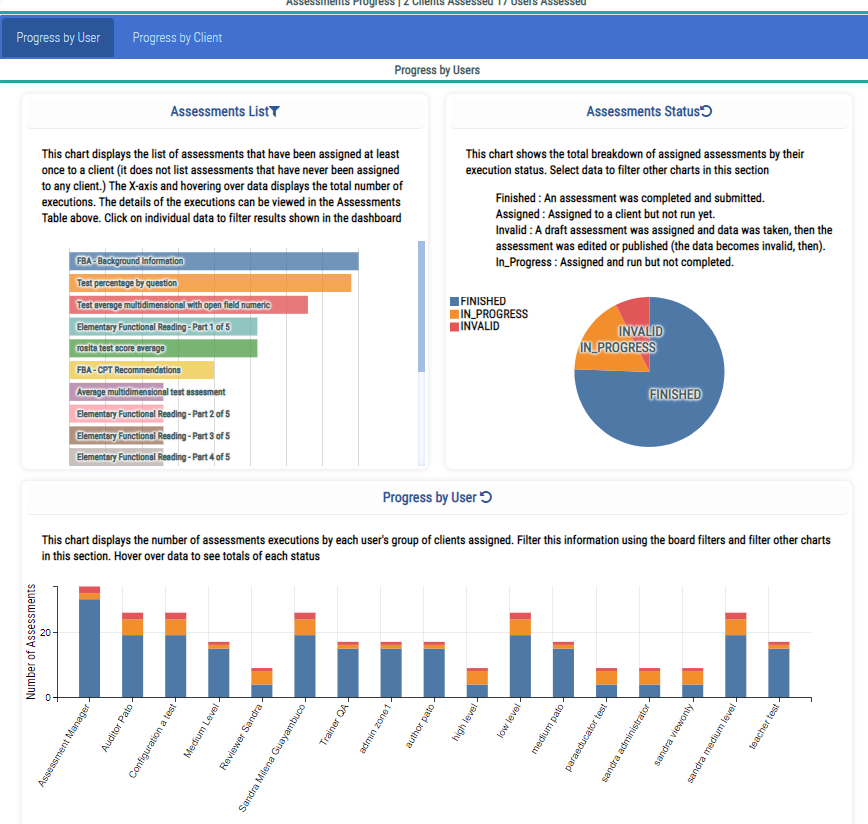
Chart |
What data is shown |
Assessment List |
The bars display the number of executions of each assessment. Hover to view the count. Click or tap on one or more bars to filter this section |
Assessment Status |
The pie chart represents the proportion of execution in each execution status. Hover to view the count. Click or tap on one or more slices to filter this section. |
Progress by User chart |
This chart displays the number of assessments executions by each user's group of clients assigned, disaggregated by status. Hover over data to see totals of each status |
Step 7: Assessment Progress by Client
Next to the Progress by User tab, in the Progress by Client tab, you can review the overall progress of each client. If you are interested in viewing the dates of each execution, see the “Assessment Table”. In the table below, there are more details of each chart and table.
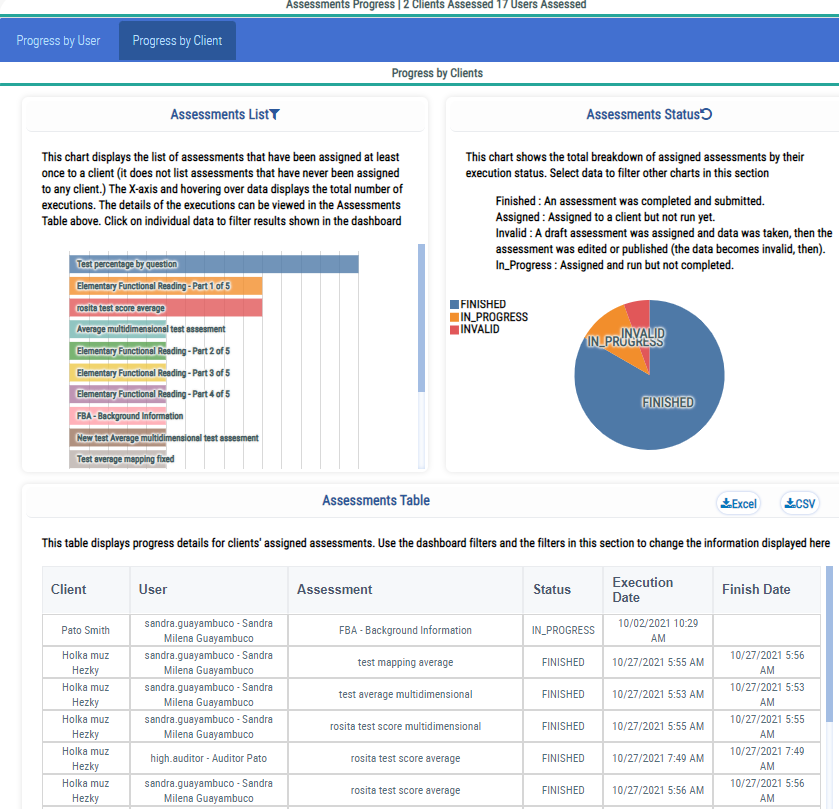
Chart |
What data is shown |
Assessment List |
The bars display the number of executions of each assessment. Hover to view the count. Click or tap on one or more bars to filter this section |
Assessment Status |
The pie chart represents the total breakdown of executions by execution status. Hover to view the count. Click or tap on one or more slices to filter this section. |
Progress by Client chart |
This chart displays the number of assessments executions by each client, disaggregated by status. Hover over data to see totals of each status |
Assessment table |
This table displays the detail of each execution. The table has the following columns:
Click on the button “Excel” or “CSV” to export the table to a .xlsx or .csv file. |
Step 8: Scores results
At the top of the screen, in the third tab, the Assessment Scoring tab displays the information for the selected clients and dates. Data in the charts may be selected to filter other charts in this section and display the assessment scores based on score types and question categories. Detailed results can be viewed or exported in the Scores Table below.
It does not display assessments that have "None" selected as the scoring type. Select data in the chart to filter other charts in this section
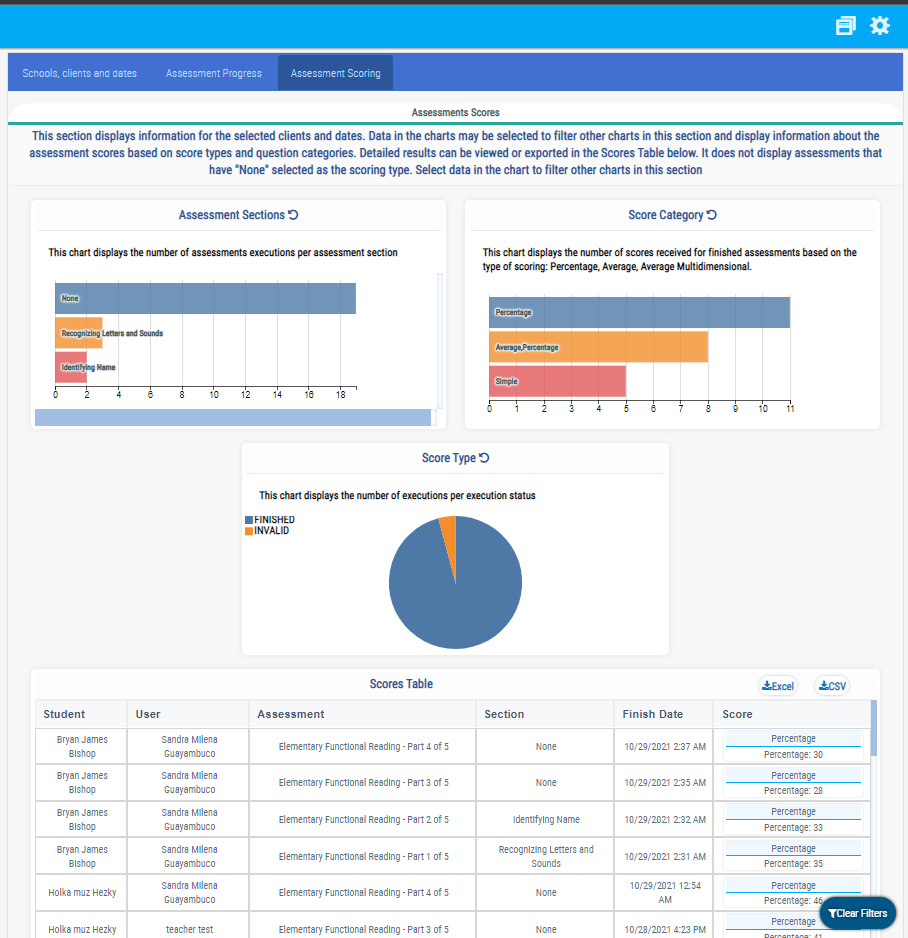
Chart |
What data is shown |
Assessment List |
The bars in this chart display the number of executions of each assessment. Hover to view the count. Click or tap on one or more bars to filter this section |
Assessment Status |
The bars in this chart display the number of executions of each assessment. Hover to view the count. Click or tap on one or more bars to filter this section |
Assessment Sections |
This chart displays the number of scores received for finished assessments based on individual sections scored |
Scores by Category |
This chart displays the number of scores by category received for finished assessments |
Score Type
|
This chart displays the total breakdown of assessments executions by status. |
Scores Table |
This table displays the details of each assessment execution. Click on the button “Excel” or “CSV” to export the table to a .xlsx or .csv file. The columns of the table are the following:
|