The Account Usage Dashboard is an interactive tool designed to provide real-time insights into client and user activity within your center. It tracks key metrics related to account management, including account creation, deletion, activation, and inactivation, which directly affect your monthly billing based on the number of active accounts in your subscription plan.
You can find this dashboard labeled as "Account Usage Dashboard" in the Dashboards section of your account interface.
Access Permissions
To view this dashboard, users must have either the ACCOUNT_OWNER or ACCOUNT_MANAGER roles. By default, the ADMINISTRATOR role does not have access to this dashboard.
Dashboard Structure
The dashboard is divided into two tabs:
- Clients Tab (default view)
- Users Tab
Clients tab
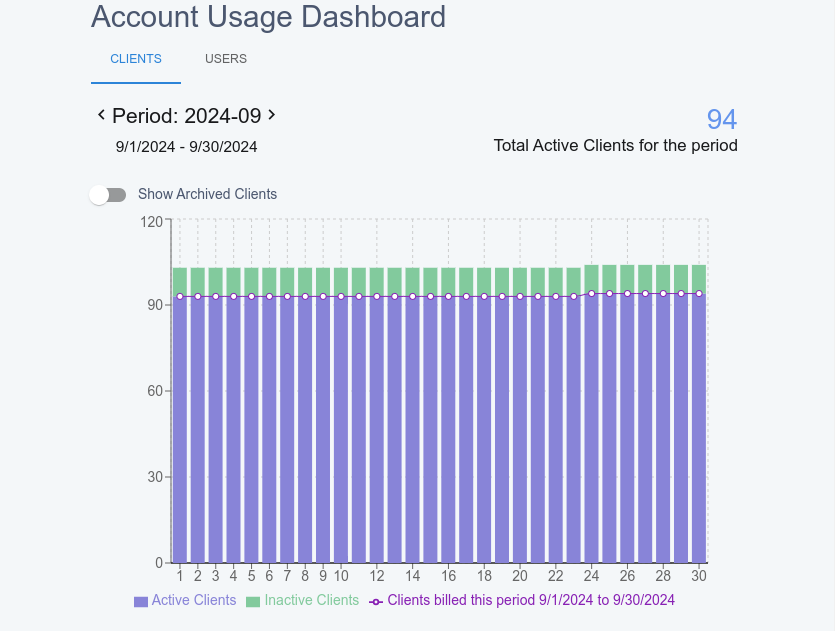
This tab allows you to monitor client activity and its impact on billing. It includes a period selector (based on calendar months according to your center’s timezone settings) and a chart that displays:
- The total count of active clients for the selected period (used for billing purposes).
- The number of active and inactive clients on a monthly basis.
Key Insights:
- The purple line labeled "Clients Billed This Period" will always show a constant or increasing value, reflecting activations during the period. Unlike the "Active Clients" columns, which can decrease if clients are inactivated, the "Clients Billed This Period" line only shows clients who were active at any point during the period.
- If a client is inactivated but reactivated within the same billing cycle, they will still count toward your billing for that period. Only clients who remain inactive throughout the entire billing cycle will affect the total billed accounts.
Showing archived clients
There is a "Show Archived Clients" toggle, which is disabled by default. When enabled, the chart will display archived accounts on the negative axis to highlight that they do not contribute to billing.
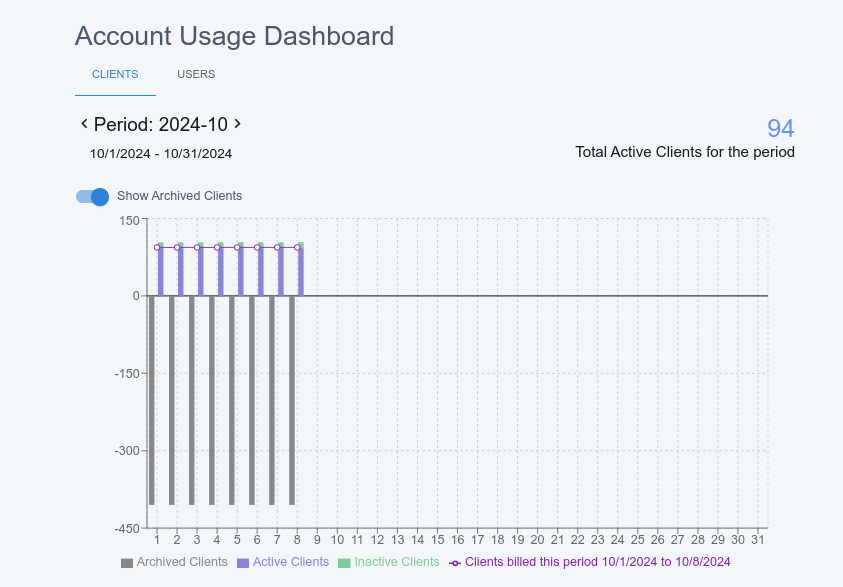
Daily Data Exploration
You can click on the circles representing each day in the chart to view detailed daily metrics in a table below the chart. The table includes:
- The number of active clients on a specific day.
- The cumulative total of active clients from the beginning of the period to the selected day.
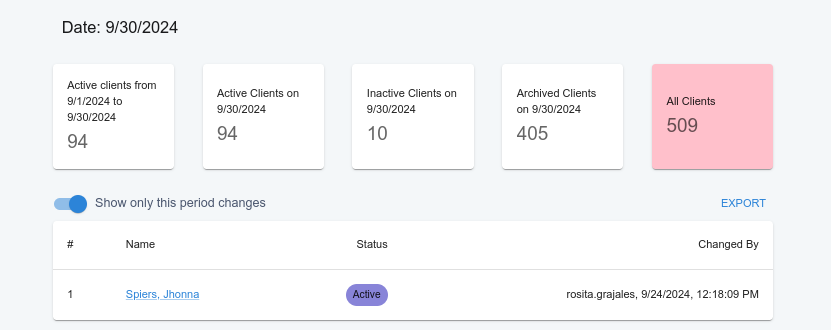
There is also a toggle that allows you to narrow down the table to only show clients whose status changed during the current period. Additionally, an export option in the upper-right corner of the table allows you to download the data in Excel format for further analysis.
Users Tab
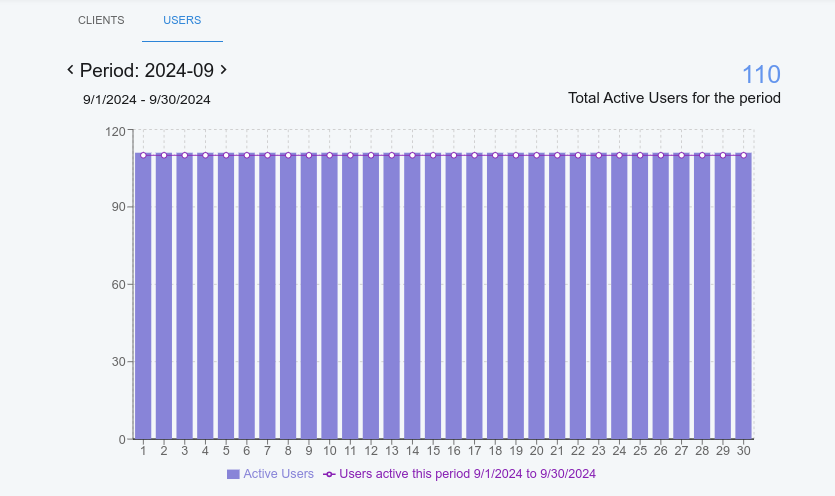
The Users Tab is similar to the Clients Tab, with one key difference: users cannot be activated or inactivated . As a result, the chart only shows the number of active users .
Similar to the Clients Tab, the Users Tab also includes a detailed table of daily user activity, with an export option for downloading the data into Excel format.