Scoring per section and/or per category
Compatibility of Scoring Models
Verifying scoring in the Assessment History
Verifying scoring in the Assessment Dashboard
Example: Average with categories
Introduction
The Assessment module in UnitusTI is your all-in-one feature for creating, administering, analyzing, reporting, enhancing and distributing assessments for your clients or staff. An assessment goes beyond a simple question and answer form by offering html formatted text, images and videos, a wide variety of question types (including rating scale, true/false, multiple choice, open text, etc.), auto fillable demographic fields that connect to your client’s profile, mapping to suggested programs and a variety of scoring options . This help guide presents the different types of Scoring Models available for assessments, along with recommendations and examples of usage.
Scoring Overview
Before publishing your Assessment so that it can be assigned and run with your clients, you must choose a scoring model from the Scoring tab in your assessment draft. You can opt for no scoring by choosing “none”, or associate one of the available scoring models to obtain results that can be explored in the Assessment Dashboards, for example to monitor progress over time for a single client or compare the results of a group of clients. If scoring is set to anything other than “None”, scores are computed at the end of an Assessment execution and the results can be viewed in the Assessment Dashboard, located in the Dashboard main menu area.
When you are creating or editing an Assessment (from the Assessment List menu area), the “Scoring” tab appears as the final optional step. By default, the Model Type is “None”, but there are a variety of other options available:
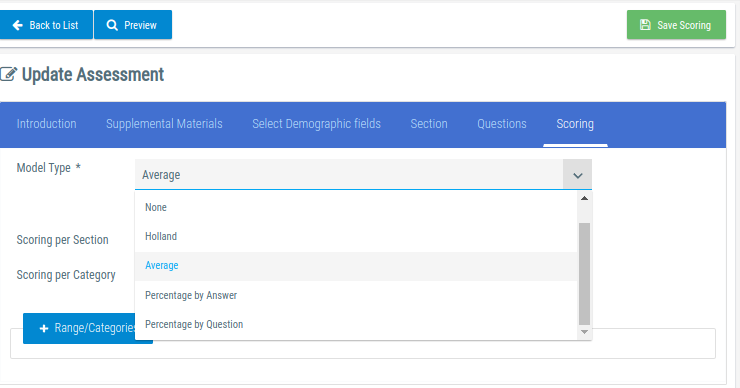
Each Scoring Model has different rules and restrictions. For example, not all the types of questions are supported for certain Scoring Models.
This is the list of the most common Scoring Models used. Click on each title to obtain more information for each one:
Scoring Model |
Description |
None |
The default setting. No scoring will be computed. |
Percentage by Answer |
The score will be computed as the percentage of total valid answers. |
Percentage by Question |
The score will be computed as the percentage of total valid questions. |
Average |
The score will be computed as the average of values of the valid questions. |
Scoring per section and/or per category
By default, a single score is computed for the whole assessment. But you can enable the “Scoring per section” and “Scoring per category” options to obtain additional sub-scores for groups of questions.
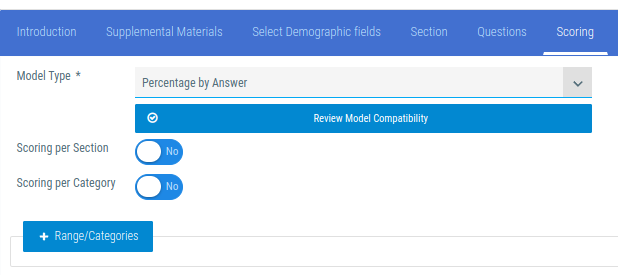
The combination of these two flags produce four scoring cases that we are going to detail next, but as a rule of thumb, consider the following suggestions to decide what case serves better your needs:
Case |
When to use it |
No Sections, no Categories |
You are only interested in a global score for the whole assessment. |
Per Sections |
Your assessment is divided in sections and you are interested in separated scores per section.
Example: You want an assessment to evaluate the feeling of security that a child experiences in different environments. Sections may be: Home, School and Street. In this case, the same questions can be repeated in each section, and you want to obtain independent scores for each place. |
Per Categories |
While sections also split visually the questions in separate screens, having each question a single section or none (you can’t assign the same question to multiple sections at the same time).
On the other hand, categories are an “invisible” way of question grouping, even allowing a question to be assigned to multiple categories.
Use this case if you want to obtain multiple scores in a way that is different to the visual organization of your assessment in sections, or if you have questions that belong at the same time to multiple groups. |
Per Sections and Categories |
This case provides multiple scores organized as a tree. The root of the tree is the general score, with scores per section as direct children. Each section will have a list of categories, as the leaves of the three.
Use this case only if you want multiple scores per section.
Following the example of the “Feeling of security” assessment, were we have the sections representing each place (home, school, street), we also can assign the questions to categories like “environmental fears” and “social fears”, and obtain a tree like this one:
global score
|
A note about weights
When you design an assessment, you can assign a custom weight to each question.
The default weight is 1.0, if all the questions in your assessment have the same weight, it means that they will contribute equally to the final score.
Assigning a higher weight to some of the questions means that you consider that those particular questions should affect the score more than the ones with default weight.
For most of the examples we will assume the default weight 1.0, but you should remember that you can affect the score by changing the weight per question.
Compatibility of Scoring Models
Not all the questions are valid for all the scoring models.
For example, certain scoring models will work only with certain types of questions, ignoring all the other types (specific restrictions are presented in the next section).
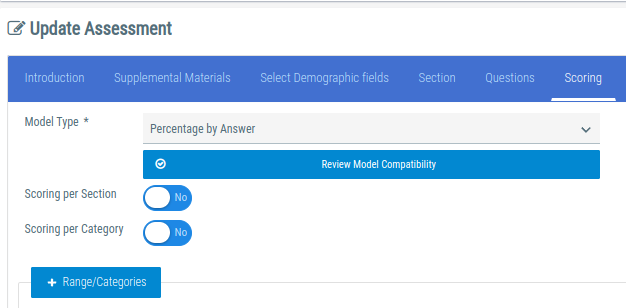
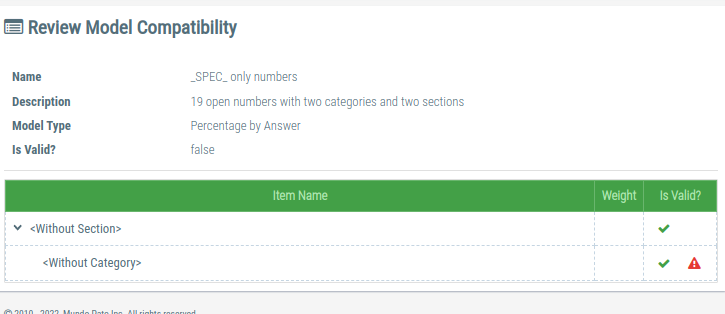
When you assign a Scoring Model to your assessments, you can always verify if the compatibility between them, by using the button “Review Model Compatibility” that is located right below the list of Scoring Models:
In this example, we run the compatibility test for an assessment that has 19 questions of type “Open Number”. This particular type of question is not compatible with the “Percentage by Answer” Scoring model, so we obtain a warning in the “Is Valid” column, indicating that there were found no valid questions for the model:
Scoring Models
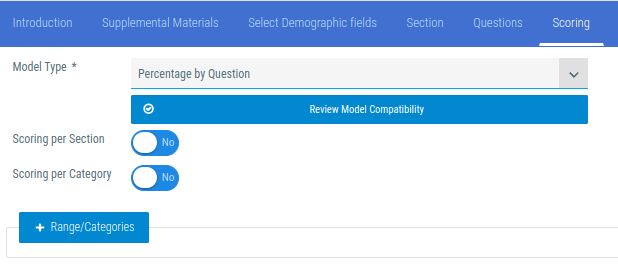
Percentage by Question
Compatible Question Types
All the question types that can define a Correct Response :
- Binary
- Multiple Option “One option or Many”
- Multiple Option “Only One”.
Not supported questions : Open Fields and Multiple Option of type “Rating Scale”.
Scoring Rule
This Scoring Model takes all the questions of supported types and sums the Correct Responses defined in each question multiplied by the weight of the question [2] .
Then, the score is computed as the weighted sum of right answered questions over the weighted sum of total valid questions.
Example
In this example, we have 5 questions, but only the first three are compatible with the Scoring Model, so the total number of valid questions is 3. Questions 4 and 5 are treated as inexistent for scoring purposes.
Question |
Type |
Weight |
Responses |
Q1: 1 + 1 = 2 ? |
yes/no |
1.0 |
|
Q2: 2 + 4 = ? |
one option or many |
1.0 |
|
Q3: 1 + 2 = ? |
only one |
1.0 |
|
Q4: 3 + 1 = ? |
range from 0 to 10 |
1.0 |
not compatible! ranges doesn’t have a right answer. |
Q4: 5 + 1 = ? |
open field: number |
1.0 |
not compatible! open fields don't have a right answer. |
Now, let’s imagine that a student answers the assessment in the following way:
Assessment execution |
Num of valid Responses |
Num of right answers |
question score: weight * (right Ans. / valid Resp.) |
Q1: 1 + 1 = 2 ? yes |
1 |
1 |
1.0 * (1/1) = 1.0 |
Q2: 2 + 4 = ? six |
2 |
1 |
1.0 * (½) = 0.5 |
Q3: 1 + 2 = ? 2 |
1 |
0 |
1.0 * (0 / 1) = 0 |
Q4: 3 + 1 = ? 5 |
N.A. |
N.A. |
N.A. |
Q4: 5 + 1 = ? 3 |
N.A. |
N.A. |
N.A. |
FInal Score (3 is the total of compatible questions) |
|
|
= (1.0 + 0.5 + 0) / 3
= 1.5 / 3
= 0.5 => 50%
|
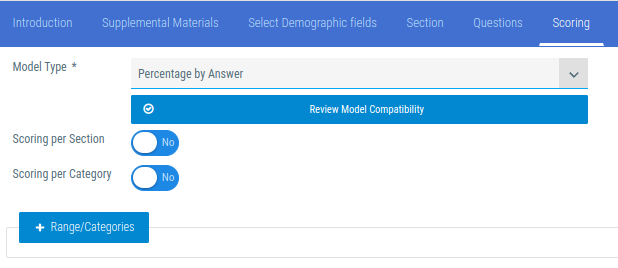
Percentage by Answer
Compatible Question Types
The same that Percentage by Question
- This Scoring Model takes all the questions of supported types and sums the Correct Responses defined in each question multiplied by the weight of the question ( same as Percentage By Question ).
- Then, the score is computed as the weighted sum of right answers over the weighted sum of total valid responses .
This is the unique difference with Percentage by Question: for the former, we assume the 100% is the total number of valid questions, but for this model, we are using the total number of valid response options!
An immediate implication is that t he total number of defined Correct Responses may be greater than the total number of questions . This may have two causes:
- Not supported questions (like Open Fields) have no defined Correct Responses (zero).
- The type “Multiple - One option or many” may have multiple options marked as “Correct Responses”, therefore, a single question may contribute more than 1 to the count of Total number of Correct Responses.
Example
We are repeating here the example for Percentage By Question, we are applying the new Scoring Model to see how they differ:
Question |
Type |
Weight |
Answers |
Q1: 1 + 1 = 2 ? |
yes/no |
1.0 |
|
Q2: 2 + 4 = ? |
one option or many |
1.0 |
|
Q3: 1 + 2 = ? |
only one |
1.0 |
|
Q4: 3 + 1 = ? |
range from 0 to 10 |
1.0 |
not compatible! ranges doesn’t have a right answer. |
Q4: 5 + 1 = ? |
open field: number |
1.0 |
not compatible! open fields don't have a right answer. |
Now, let’s imagine that a student answers the assessment in the following way:
Assessment execution |
Num of valid Responses |
Num of right answers |
question score: weight * (right / valid answers) |
Q1: 1 + 1 = 2 ? yes |
1 |
1 |
1.0 * (1/1) = 1.0 |
Q2: 2 + 4 = ? six |
2 |
1 |
1.0 * (½) = 0.5 |
Q3: 1 + 2 = ? 2 |
1 |
0 |
1.0 * (0 / 1) = 0 |
Q4: 3 + 1 = ? 5 |
N.A. |
N.A. |
N.A. |
Q4: 5 + 1 = ? 3 |
N.A. |
N.A. |
N.A. |
FInal Score ( 4 is the total of valid responses) |
|
|
= (1.0 + 0.5 + 0) / 4
= 1.5 / 4
= 0.375 => 37.5%
|
Conclusion: The only difference between Percentage By Question and Percentage By Answer is the final step when computing the total score: the former divides over the total number of compatible questions, but the later divides over the total number of valid responses, potentially producing a lower score, because it may be more valid responses than valid questions.
Example
This is better explained with an example.
The following Assessment had been defined with six questions (we are assuming the default weight of 1.0 for all the questions):
|
Question |
Configuration |
1 |
2 +2 = 4 ? |
|
2 |
3 + 2 = 5 ? |
|
3 |
4 + 2 = ? |
|
4 |
5 + 3 = ? |
|
5 |
How did you rate this test? |
|
6 |
Something to say? |
|
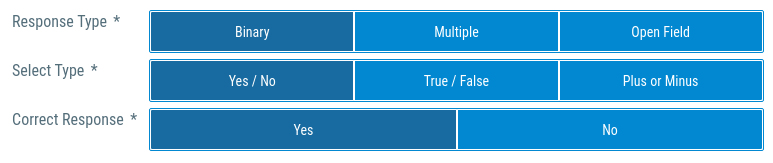


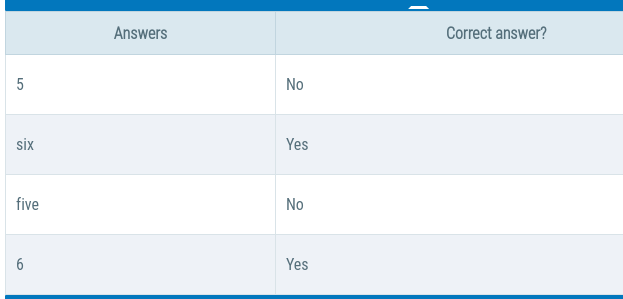

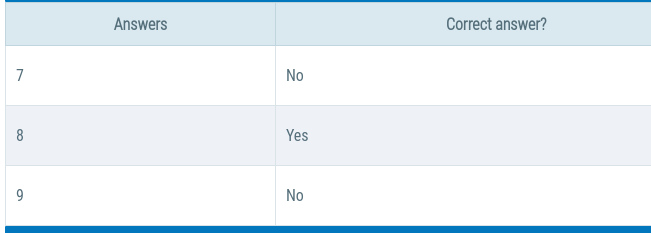

The first four questions of type Binary and Multiple have an associated “Correct Response”. These are the ones expected to be taken into account by the Percentage Scoring Model .
The third question is of type “Multiple - One option or many” and has two correct responses (“6” and “six”).
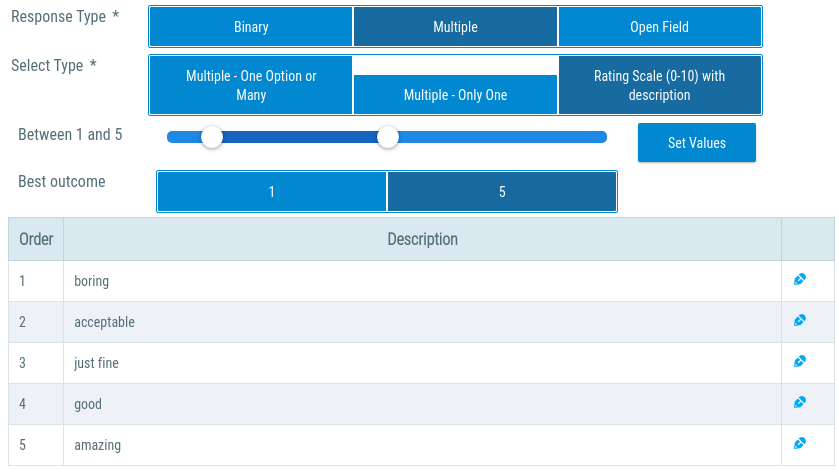
The fifth question (“How did you rate this test?”) is a Multiple Rating Scale. Rating Scale can’t be used with Percentage Scoring, because it hasn’t an associated Correct Answer.
The sixth question is an Open Field. this one can’t be used in any Scoring Model.
Executing the Assessment
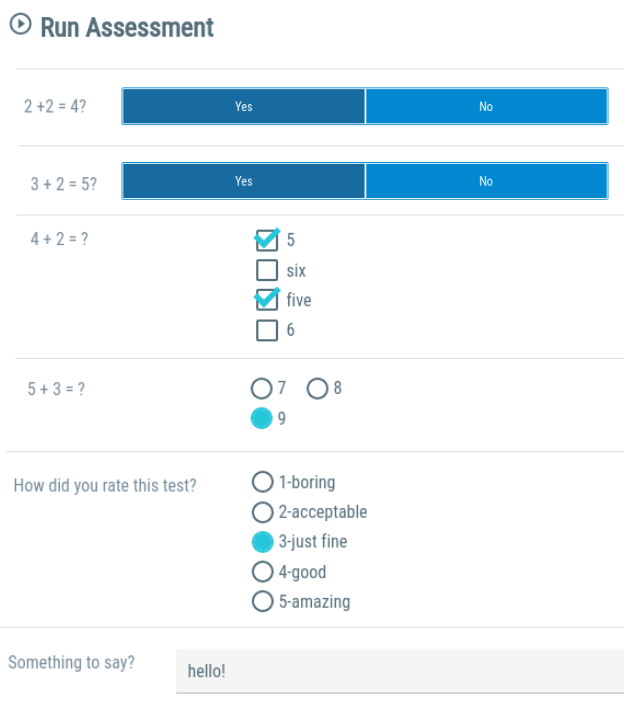
After saving as Draft and assigning the Assessment to a Client, we can run our first execution. In this example, we gave the right answers for questions 1 and 2, and wrong answers for the questions 3 and 4:
Computing the Score
According to the Scoring Rule, first we have to sum the total number of Available Correct Responses multiplied by the weight defined for each question:
Question |
Available Correct Answers |
Weight |
Maximal participation of this question in the final Score |
1 |
1 |
1 |
1 * 1 = 1 |
2 |
2 |
1 |
2 * 1 = 2 |
3 |
1 |
1 |
1 * 1 = 1 |
4 |
1 |
1 |
1 * 1 = 1 |
5 |
0 |
1 |
0 * 1 = 0 |
6 |
0 |
1 |
0 * 1 = 0 |
TOTAL |
5 |
|
1 + 2 + 1 + 1 + 0 + 0 = 5 |
Second, we have to sum the weighted Correct Answers provided during the execution:
Question |
Correct Responses |
Weight |
Maximal participation of this answer in the final Score |
1 |
1 |
1 |
1 * 1 = 1 |
2 |
1 |
1 |
1 * 1 = 1 |
3 |
0 |
1 |
0 * 1 = 0 |
4 |
0 |
1 |
0 * 1 = 0 |
5 |
(not apply) |
1 |
0 * 1 = 0 |
6 |
(not apply) |
1 |
0 * 1 = 0 |
TOTAL |
2 |
|
1 + 1 + 0 + 0 + 0 + 0 = 2 |
Finally, we can compute the Percentage:
Percentage = 100 x ( sum of weighted Correct Answers / sum of weighted Correct Responses)
= 100 x ( 2 / 5 )
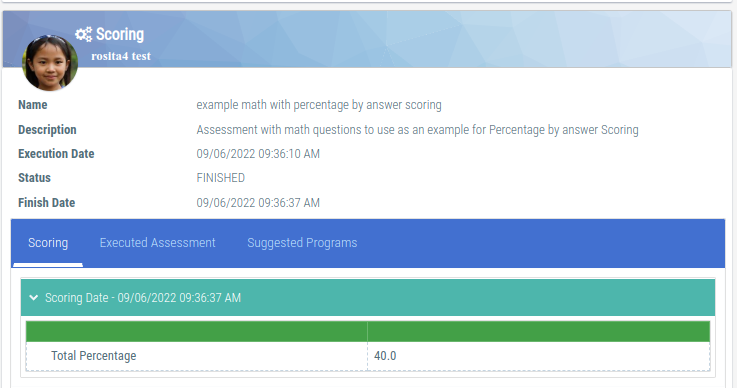
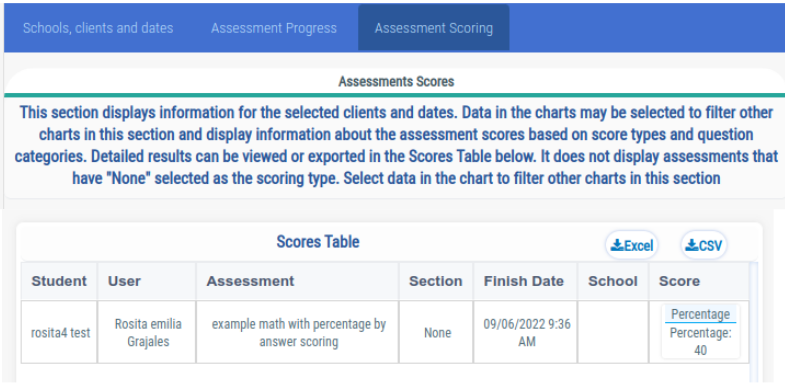
= 40%
We can verify the results in both the Assessment History and in the Scoring Dashboard.
Verifying scoring in the Assessment History
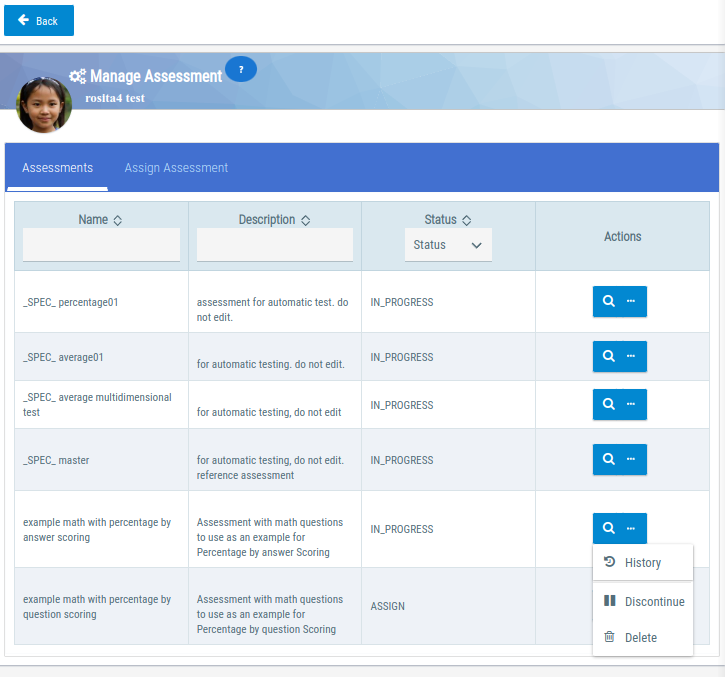
Go to Assessment - Manage Assessment, select the assessment and in the dropdown options select “History”:
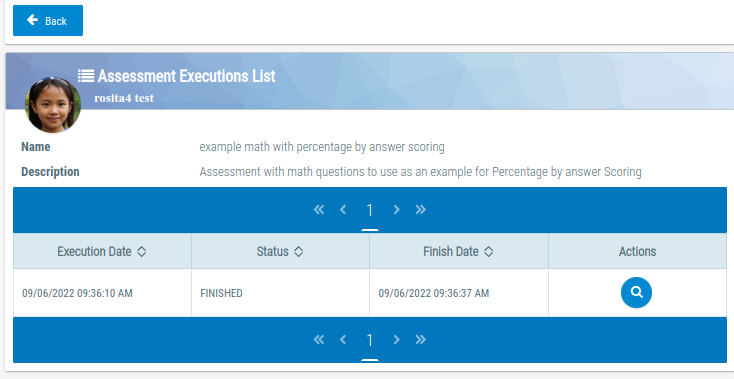
The list of executions will be presented. Select the details action button:
You will be presented with the final scoring:
Verifying scoring in the Assessment Dashboard
We also can verify this result in the Assessment Dashboard.
- Select Dashboard - Assessment Administrative Dashboard.
- Select the client and the date range for the executions.
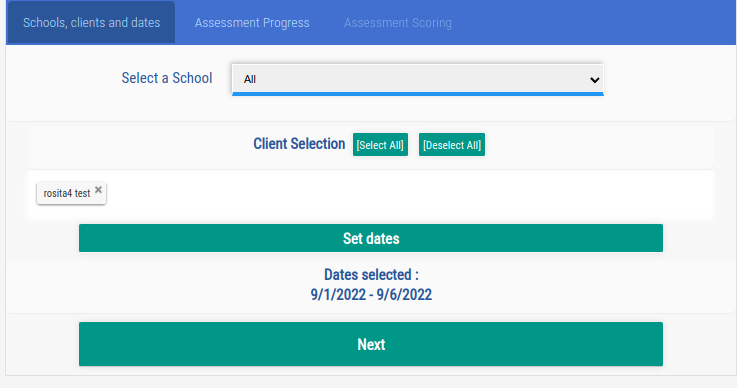
- In the third tab, “Assessment Scoring”, scroll down to the Scores Table:
Average
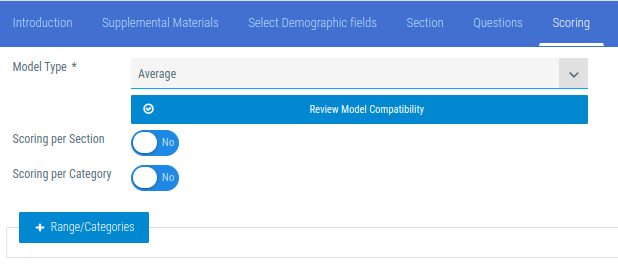
While the Percentage Scoring Models work well with Binary and Multiple types, but not with Rating Scale nor Open Fields, the Average Scoring Model works only with “Multiple-Rating Scale” or “Open Field - Number”.
Restrictions
- All the Rating Scale questions should use the same scale .
- There should not be multiple categories. In the case of Categories, all the questions should belong to the same category .
- All the questions in the assessment should be of the same type: either “Multiple Rating Scale” or “Open Field - Number”. You can’t mix them.
When you select the Average Score Model, you also have to define a global range where you expect the final score to be situated.
For example, you may want to guarantee that all your executions score between 0 and 100, or 0 and 10.
That will work fine for all the questions of type “Rating Scale” if they were created with the same range in mind. But what happens if not? And what happens with “open field - Number” where the user can type any number that he wants?
Boundary handling for Multiple - Rating Scale
For questions of type “Multiple - Rating Scale” the answer is scaled proportionally, until it matches the global scale.
some examples:
Question Range |
Execution Answer |
Global Range |
final answer |
0 - 10 |
5 |
0 - 100 |
50 |
0 - 10 |
10 |
0 - 100 |
100 |
0 - 10 |
5 |
0 - 5 |
2.5 |
0 - 10 |
10 |
0 - 5 |
5.0 |
Example
In our previous example we already had defined a Rating Scale question that was not used by the Percentage Scoring Model. We will create a new Assessment with a couple of questions (we will use the default weight of 1.0 for all the questions):
|
Question |
Configuration |
1 |
From 1 to 5, How much do you want to share this test with your friends? |
|
2 |
From 1 to 5, How much do you would like to repeat this test? |
|
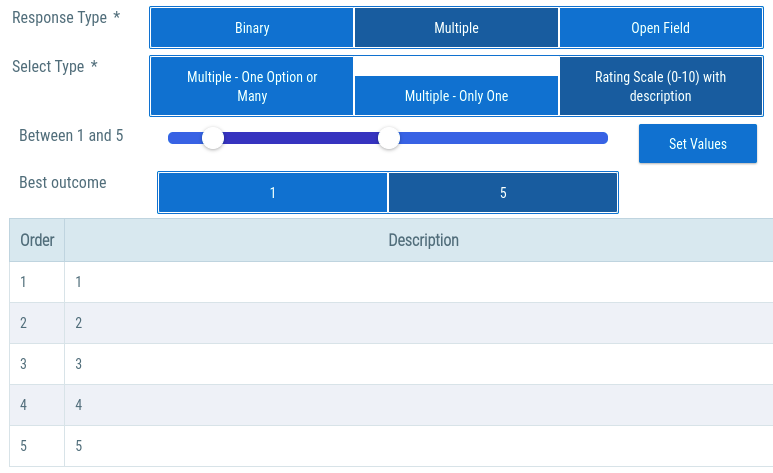
Finally, we had to change the Scoring Model from Percentage to Average. Notice how we define the Scoring Range as 1-5, the same range used in our Rating Scale question.
Also notice that we had to define a Category for all the questions in the Assessment.
Note: Remember that by doing changes to an Assessment, all previous executions will be marked as invalid!
Executing the Assessment
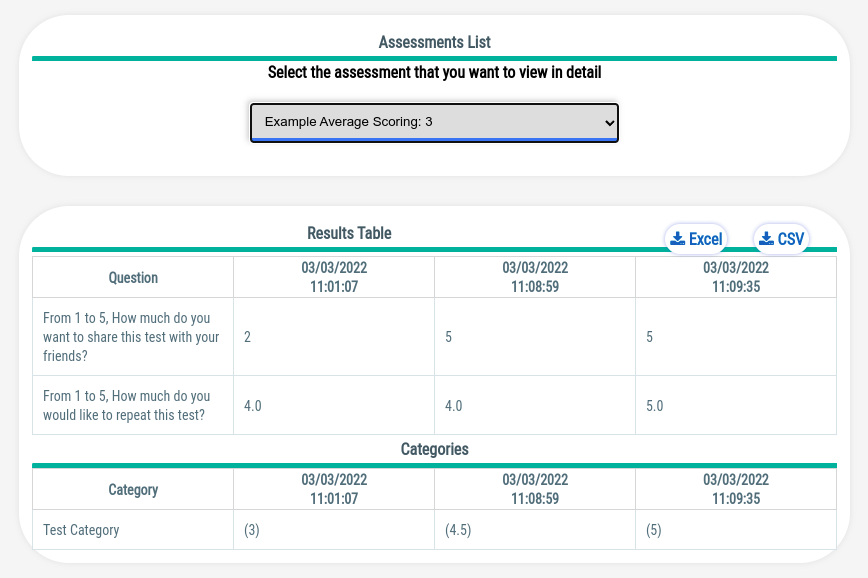
We run the assessment three times, this is the first execution (2, 4):
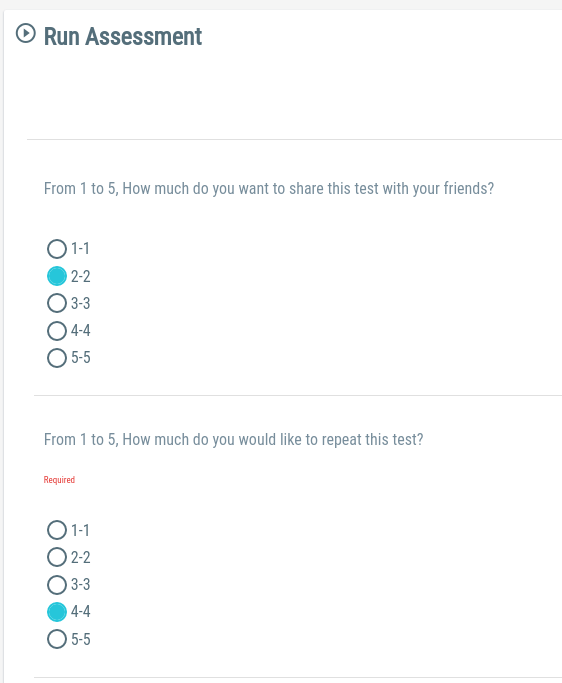
The other executions were (5, 4) and (5, 5). This is how the executions looks like in the Assessment Dashboard:
Computing the Score
The Average Scoring Model produces two results: the Average and the Percentage.
The Average is the sum of all the answers over the total number of questions.
Average = (answer to question 1 + answer to question 2) / 2 questions in total
The Percentage is computed with the following expression:
(( Average - Lower boundary) / (Upper boundary - Lower Boundary)) * 100
In our example, the Lower and Upper boundaries are 1 and 5.
For the first execution (answers 4 and 2) we have:
Average = ( 4 + 2) / 2 = 3
Percentage = (( 3 - 1) / (5 - 1)) * 100 = (2 / 4) * 100 = 0.5 * 100 = 50%
The summary in the Assessment Scoring Dashboard is :
Answers |
Average |
Percentage |
2, 4 |
(4 + 2) / 2 = 3 |
(( 3 - 1) / (5 - 1)) * 100 = (2 / 4) * 100 = 0.5 * 100 = 50% |
5,4 |
(5 + 4)/ 2 = 4.5 |
(( 4.5 - 1) / (5 - 1)) * 100 = (3.5 / 4) * 100 = 0.875 * 100 = 87.5% |
5,5 |
(5 + 5) /2 = 5 |
(( 5 - 1) / (5 - 1)) * 100 = (4 / 4) * 100 = 1.0 * 100 = 100% |
We can see two rows per each execution, one reports the Percentage and the other the Average.
Example: Average with categories
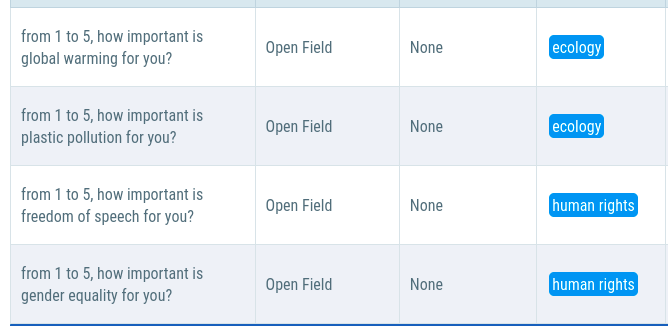
For this example, we had created two categories: “ecology” and “Human Rights”, and the assessment has four questions, two per category. All of the questions have type “Open Field - Number”:
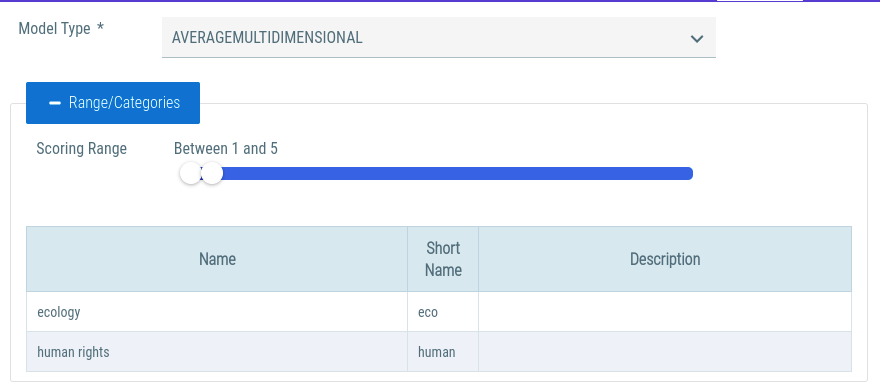
Similar to Average Scoring Model, we can define the Scoring Range when you select the Average Multidimensional:
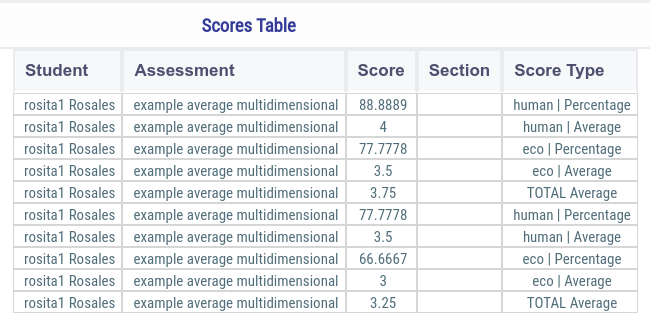
We had created two executions of the assessment, with the following results. Notice the results with the average per category in the bottom of the table:
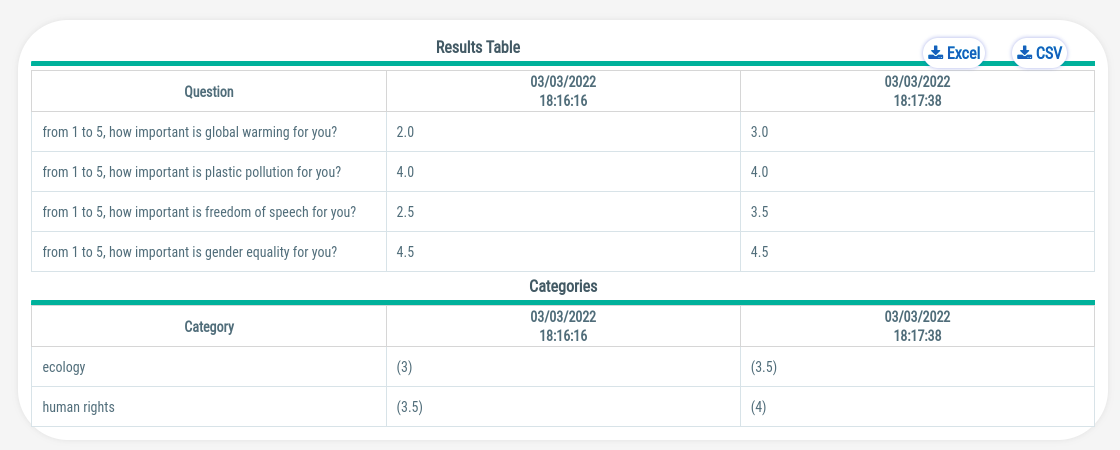
The formulas for the average and percentage per category are the same as for the Average Scoring Model. Let’s see them applied to the data for the first execution:
Category |
Answers |
Average |
Percentage |
Ecology |
2, 4 |
( 2 + 4) / 2 = 3 |
(( 3 - 1) / (5 - 1)) * 100 = (2 / 4) * 100 = 0.5 * 100 = 50% |
Human Rights |
2.5, 4.5 |
( 2.5 + 4.5) / 2 = 3.5 |
(( 3.5 - 1) / (5 - 1)) * 100 = (2.5 / 4) * 100 = 0.625 * 100 = 62.5% |
The Assessment Score Dashboard presents five records for each execution: the percentage and average per category (four records for two questions) and a final row for the total average :