This article will guide you through the process of generating graphs from program execution data and storing them as images in the client's profile area for subsequent inclusion in Program Reports.
Step 1: Generating Graphs
- Navigate to Reports: Access the "Reports" tab.
- Locate Program Execution: Select the desired client and locate the specific program execution you want to analyze.
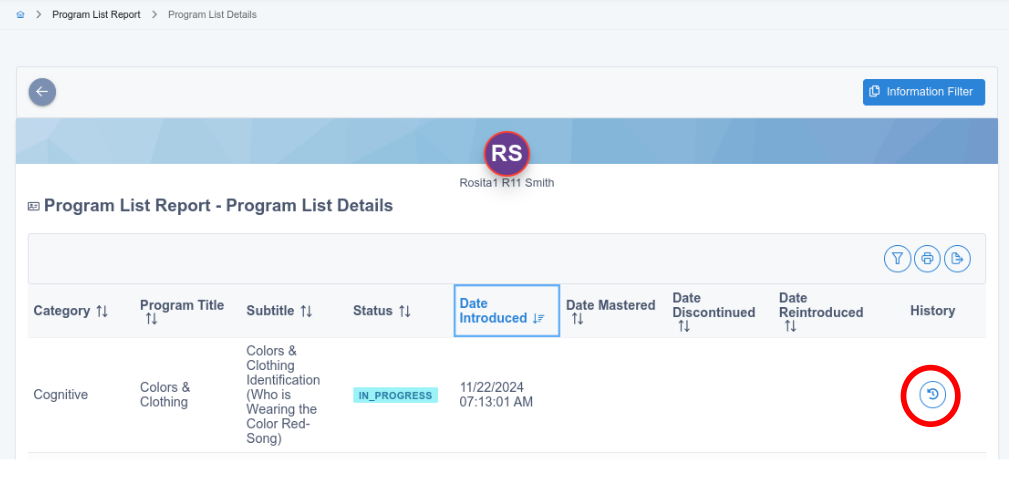
- Access History: Click on the "History" icon located at the end of the row corresponding to the program execution.
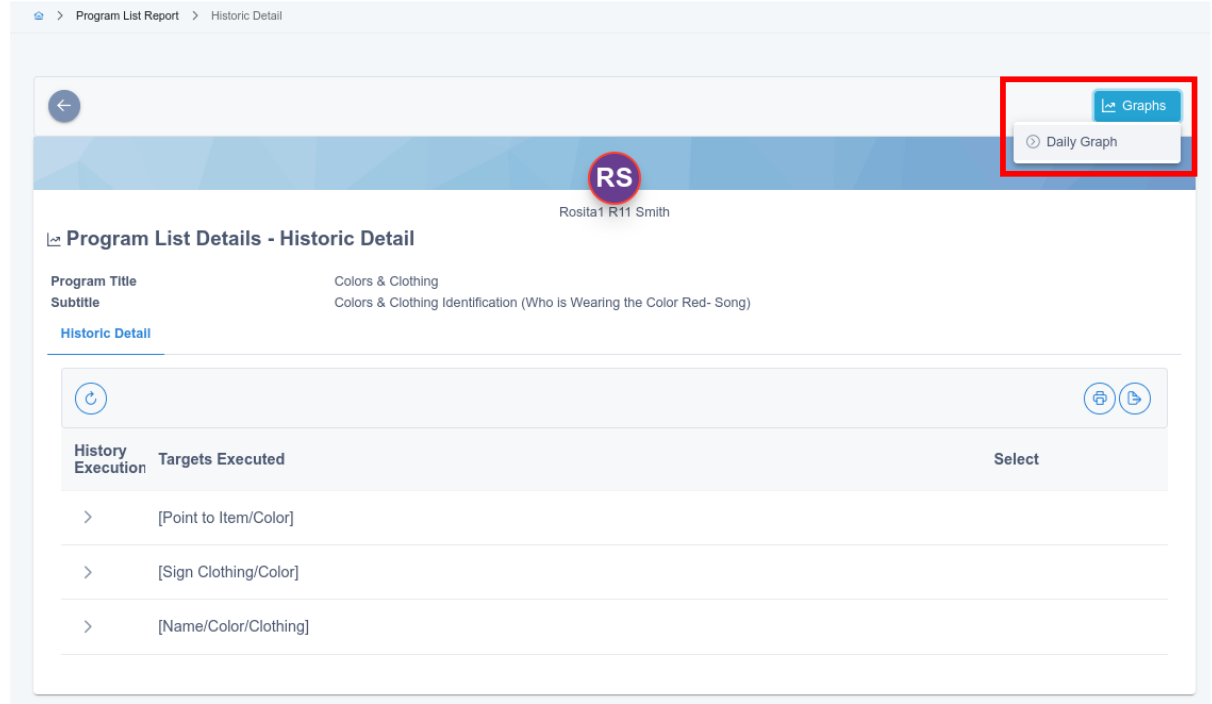
In the Historic Detail screen, select the "Graphs" option. This will display a "Daily Graph" and, if applicable, a "Session Graph" based on available data:
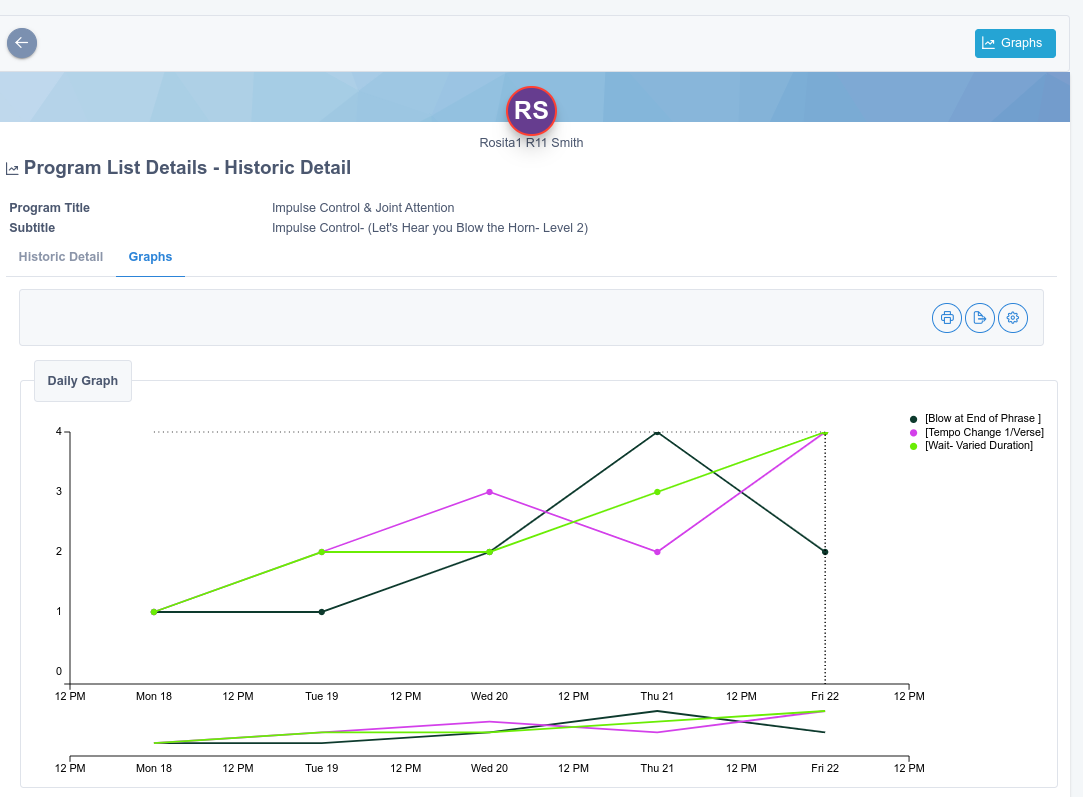
A newly generated graph will appear as follows:
Step 2: Storing the graph
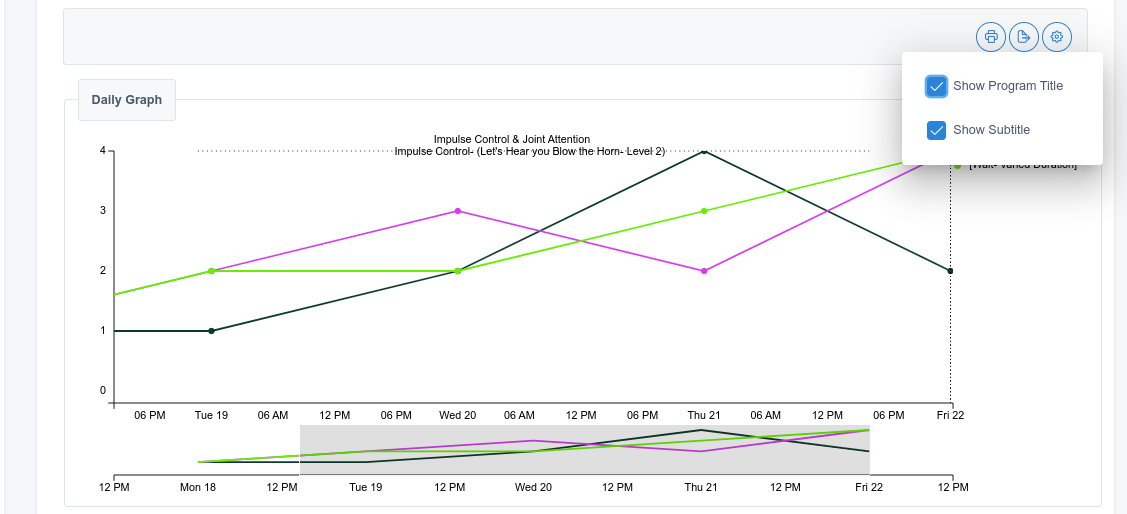
Before saving the graph, you can customize its appearance by adding a title and subtitle, as well as zooming in on specific areas of interest:
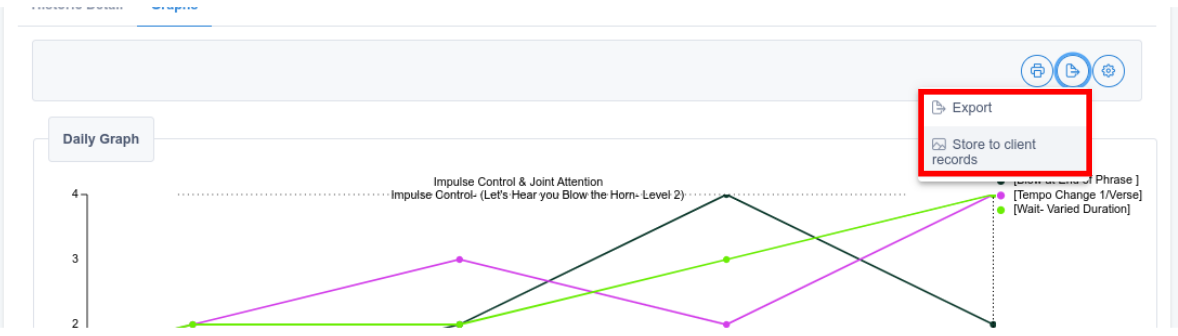
Once you are satisfied with the visualization, you can save the graph as an image. You have the option to save it locally or directly to the client's profile area for future reference and inclusion in progress reports.
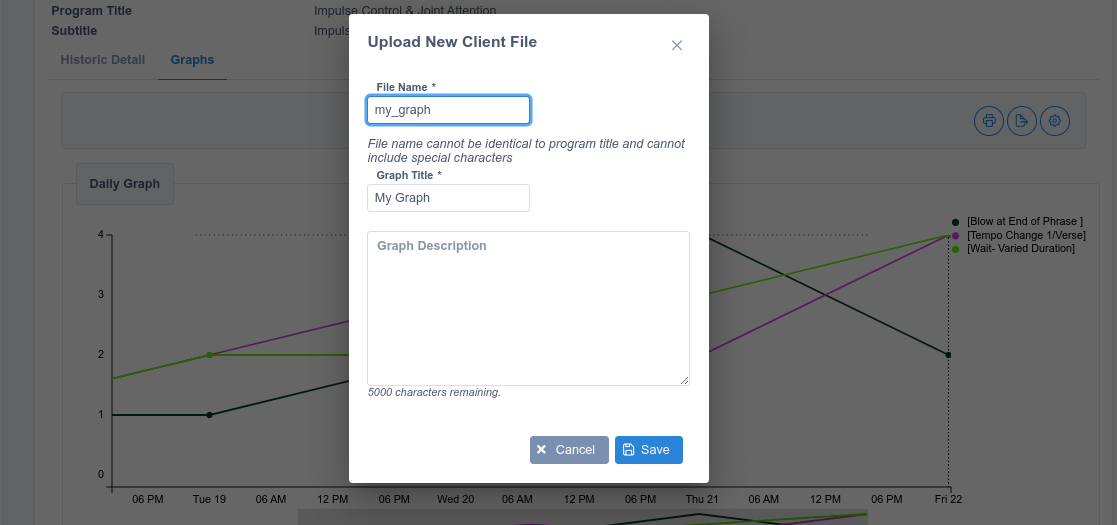
To store the graph in the Client Records, you will need to provide a filename, title, and description for the new image:
After completing these steps, the graph image will be stored in the client's records area, ready for future use in Progress Reports.
Step 3: Generating a Progress Report with graphs
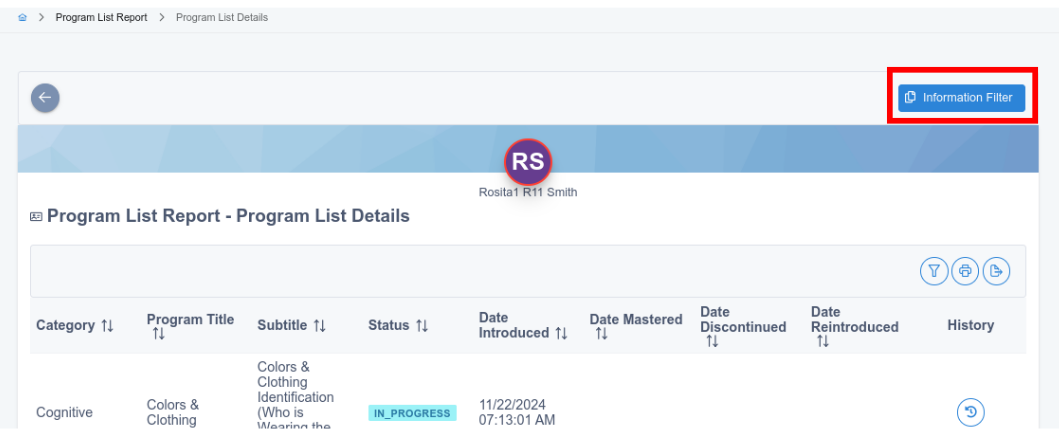
Return to the Program List Details for your client by navigating to the "Reports" option, selecting the client, and then clicking on the "Information Filter" button.
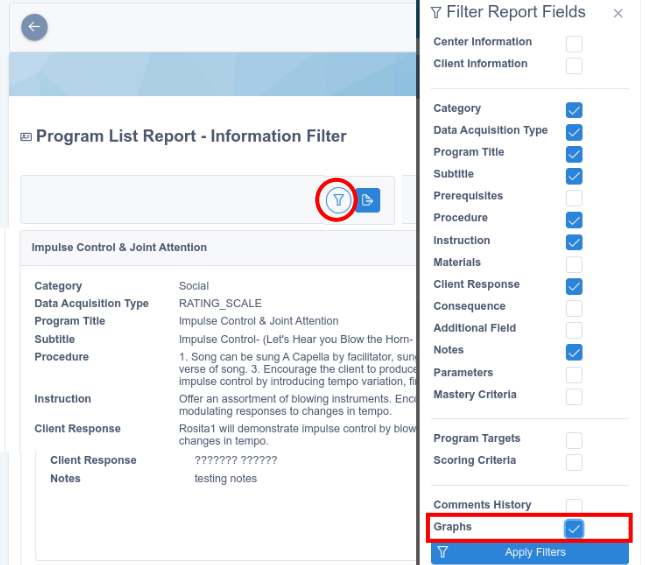
In the Information Filter screen, click on the "Filter" icon. A sidebar will appear, displaying various options. Select the "Graph" option from the bottom of the sidebar, and then click "Apply Filters.":
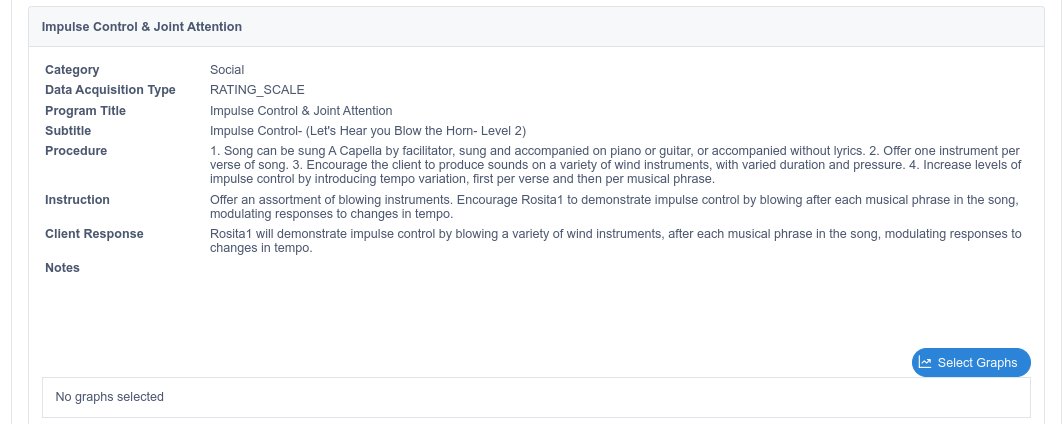
Now, at the bottom of each program, a "Select Graph" button will appear. Click this button for the program where you previously generated the graph:
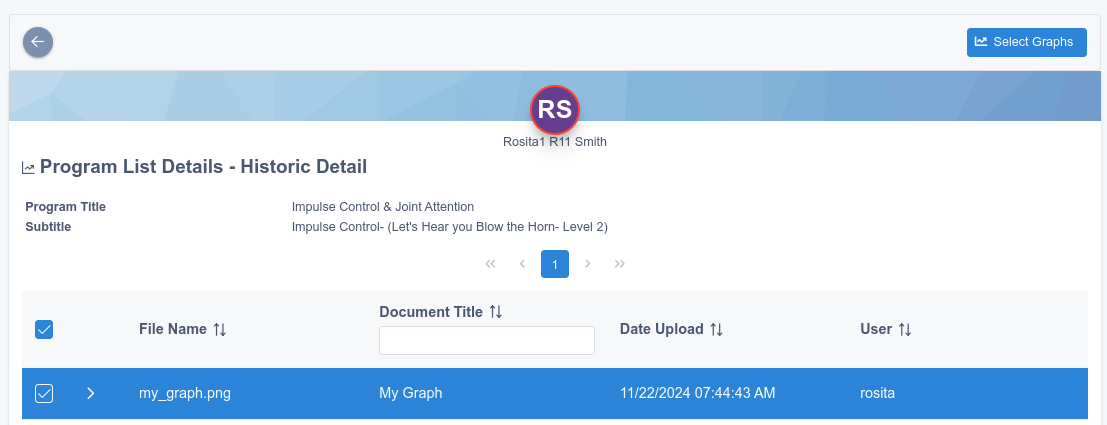
Here, you should see the file you created earlier in the tutorial. Select this file by clicking the "Select Graphs" button.
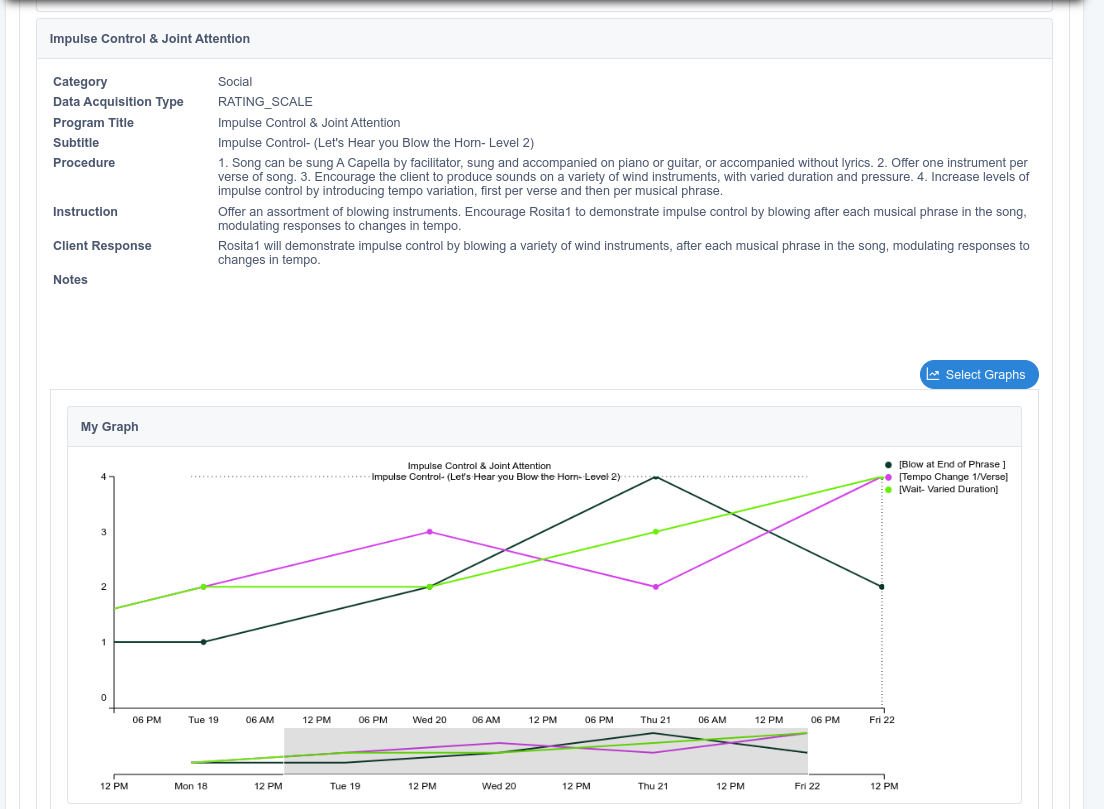
Now the graph is included with the program information, ready for export.
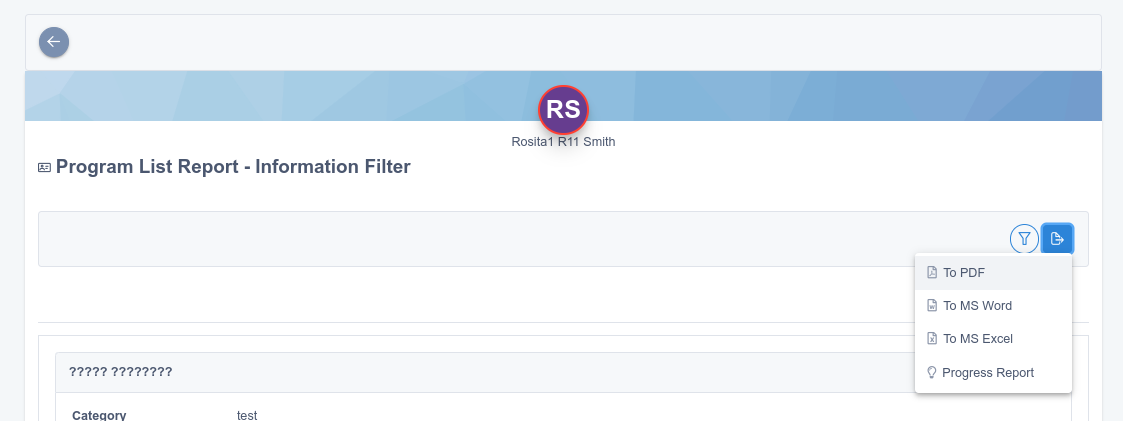
In the top right corner of the screen, click the export icon and select the "Progress Report" option:
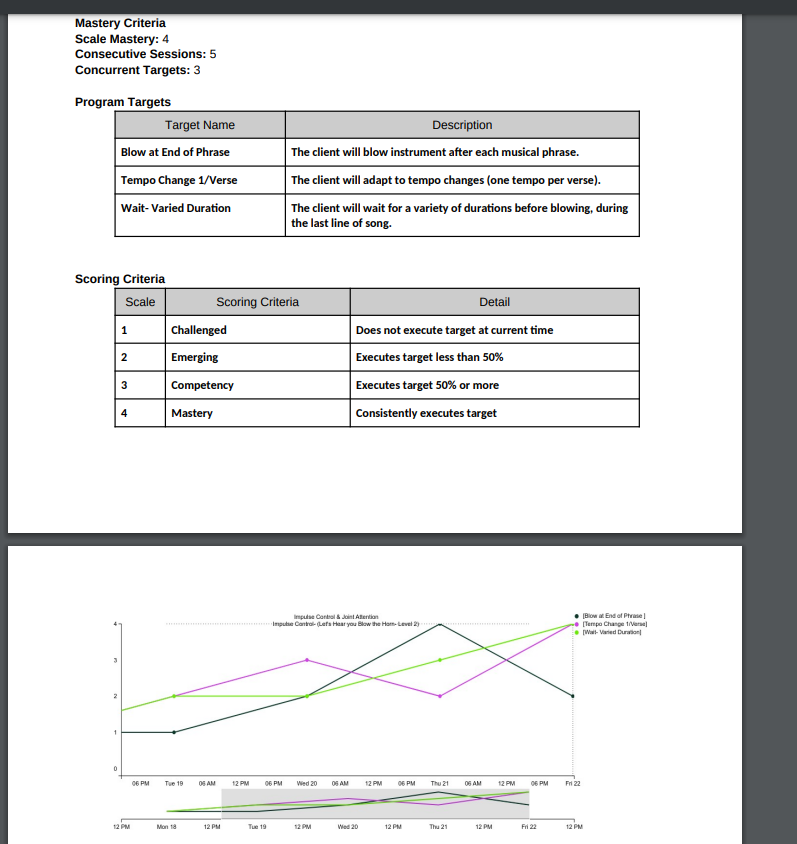
You will be prompted to choose between PDF and MS-Word formats. For this example, we selected PDF, and the final Progress Report will include the graph as shown below: